Field note 003 · Light map
Map the canopy before you move the grow light.
A center reading can look perfect while the corners remain dim. Record the crop, canopy, mounting height, dimmer setting, PPFD grid, photoperiod, and actual power draw as one lighting system.
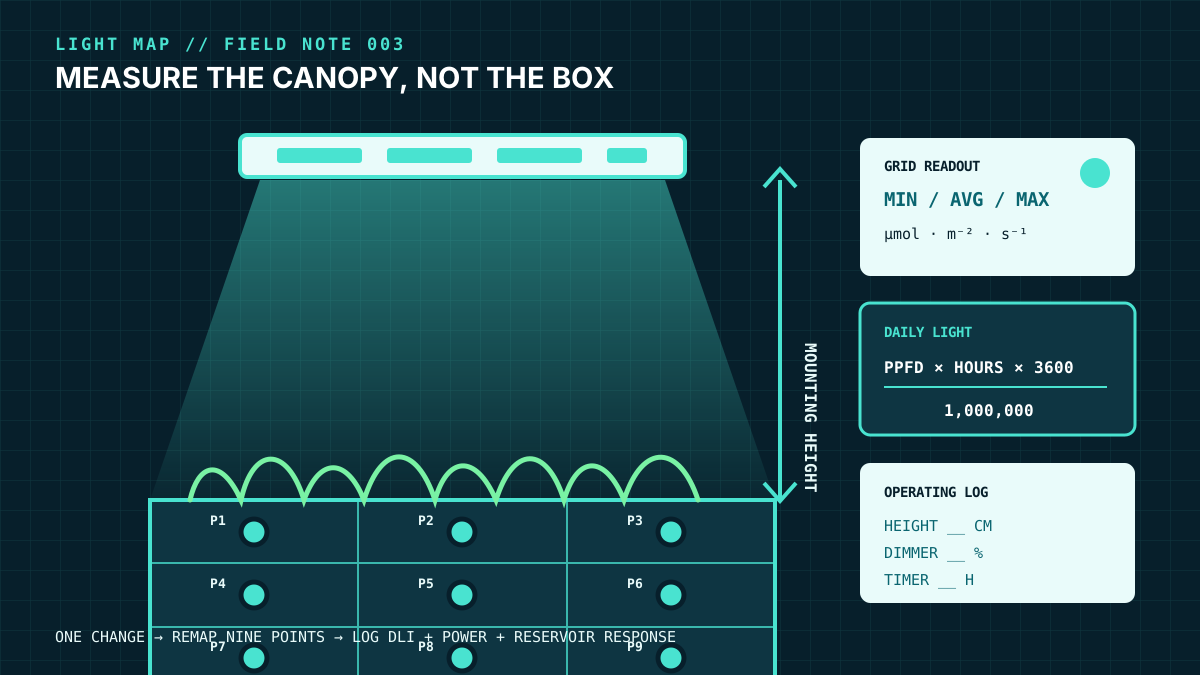
Grow-light questions often begin with fixture wattage: “Is 100 watts enough?” Wattage is useful for electrical load and operating cost, but it does not say how much photosynthetically active light reaches a leaf. Two fixtures with the same input power can differ in photon output, optical distribution, mounting height, and the size of the area they cover.
The useful unit at the canopy is photosynthetic photon flux density, or PPFD, expressed in micromoles per square meter per second. It is a momentary measurement at a point. Daily light integral, or DLI, adds those photons across the light period and is expressed in moles per square meter per day. The fixture, crop area, height, dimmer, timer, walls, neighboring fixtures, and natural sunlight all affect the result.
Follow the fixture’s installation, clearance, mounting, moisture, cord, and control instructions. Use equipment listed for its location and have electrical work completed to applicable code. Keep connections and controls away from leaks and splashes, and never defeat a ground, cover a driver, or exceed a circuit or daisy-chain rating.
1. Define the crop and the measurement plane
Start with the planted canopy, not the shelf or fixture dimensions. Record the length and width that will actually contain leaves at the crop’s mature spacing. Then record crop and cultivar, growth stage, planned photoperiod, whether the crop receives sunlight, and the crop-specific PPFD or DLI target from a current Extension production guide or research source.
Targets are not interchangeable. University of Missouri Extension uses lettuce as an example with a PPFD range of 250 to 350 micromoles per square meter per second. Purdue Extension describes leafy greens as requiring roughly 15 to 20 moles per square meter per day in its greenhouse-lighting example. University of Minnesota Extension suggests a 12- to 14-hour daily light period for hydroponic lettuce and herbs. These are planning references, not a universal recipe for every cultivar, growth stage, temperature, carbon-dioxide level, or system.
Choose one repeatable measurement plane: the top of the crop canopy. If plants are short today but will finish 20 centimeters taller, write down how the fixture or shelf will move to preserve the intended separation. Measure from the light-emitting surface to the canopy, using the fixture maker’s definition when it specifies another reference point.
- Crop, cultivar, stage, planting density, and expected canopy height.
- Canopy length and width, excluding aisles and empty shelf edges.
- Target PPFD or DLI and the source, publication date, and conditions behind it.
- Planned hours of electric light and any contribution from a window or greenhouse.
- Maximum mounting height, minimum safe clearance, and room for plants and service.
2. Read the fixture evidence, not the headline
Missouri Extension recommends checking a grow light for a spectrum graph, PPF or PPFD information, a PPFD distribution map, energy use, and efficacy. It advises avoiding lights whose manufacturers do not provide a spectrum graph and PPF or PPFD information. Lumens, lux, and Kelvin describe human visual response or appearance; they do not replace plant-light measurements.
| Listing field | What it tells you | What is still missing |
|---|---|---|
| Input watts | Electrical demand at a stated operating point. | Photon output, distribution, and canopy delivery. |
| PPF, µmol/s | Total PAR photon output from the fixture. | Where those photons land over your crop. |
| PPE, µmol/J | Photon output per joule of electrical energy. | Coverage shape, crop target, mounting fit, and controls. |
| PPFD map | Point readings across a stated area and height. | Whether test height, walls, dimmer, and area match your setup. |
| Spectrum graph | Relative output across wavelengths. | Delivered intensity, uniformity, and daily dose. |
| Rated life or warranty | A stated service or support term. | Replacement parts, output depreciation details, and seller authorization. |
A PPFD map is usable only with its test conditions. Look for the exact mounting height, mapped footprint, grid spacing, output setting, reflective boundaries, fixture orientation, and whether values represent one fixture or overlapping fixtures. A 60-centimeter map cannot be silently applied at 30 centimeters. A map in a reflective tent may not match an open shelf.
For commercial or incentive-oriented comparisons, the DesignLights Consortium maintains a current Horticultural Qualified Products List and technical requirements for LED fixtures. Qualification is evidence for particular reported attributes; it does not select a crop, layout, height, or daily dose for you.
3. Build a nine-point PPFD grid
University of Missouri Extension recommends using the manufacturer’s PPFD map or a quantum sensor to measure at each corner and the center. A nine-point grid adds the four edge midpoints and makes a small rectangular canopy easier to diagnose. Use more points for a long shelf, multiple fixtures, overlapping beams, or a visibly uneven canopy.
- Set the fixture at the documented mounting height, orientation, and dimmer setting. Allow it to reach normal operating conditions as its instructions specify.
- Divide the planted rectangle into an even three-by-three grid. Mark the nine sampling locations on a paper plan.
- Place the quantum sensor level at canopy height and in the same orientation at every point. Keep your body and tools from shading or reflecting light onto the sensor.
- Record each PPFD value with the fixture setting, height, date, time, sensor model, calibration information, room condition, and whether other fixtures or sunlight were present.
- Repeat the grid after the canopy grows, a fixture moves, reflective material changes, another light is added, or plant spacing changes substantially.
A phone app can be useful for rough before-and-after checks, but its accuracy depends on the phone sensor, spectrum, diffuser method, calibration, and app. Do not present a phone estimate as equivalent to a calibrated quantum sensor. If the crop or operating cost justifies a precise decision, use an appropriate calibrated instrument or obtain a verified map under matching conditions.
4. Convert the average PPFD to a daily light estimate
Average the grid readings only after checking that no point is clearly invalid. Then calculate the electric-light DLI:
DLI = average PPFD × light hours × 3,600 ÷ 1,000,000
250 µmol/m²/s × 14 hours × 3,600 ÷ 1,000,000 = 12.6 mol/m²/day
Required average PPFD = target DLI × 1,000,000 ÷ light hours ÷ 3,600
Electric-light DLI and changing sunlight need appropriate measurement before they are combined.
This calculation assumes the average PPFD remains stable while the light is on. Dimming schedules, window light, aging output, dirty optics, and plant growth can change the delivered dose. In a greenhouse or window-assisted system, use an integrating light sensor or a documented measurement method rather than guessing the sunlight contribution from weather icons.
Do not stretch the timer indefinitely to compensate for a poor map. Photoperiod affects crop development and must fit the crop and production plan. A longer day also increases operating hours, heat, and equipment exposure. Use the crop’s current guidance to set the permitted schedule, then choose intensity and coverage that fit it.
5. Read the center, corners, average, and minimum
A single average can hide weak corners and a single center value can exaggerate the whole fixture. Write down four values: center PPFD, grid average, minimum point, and maximum point. For a simple comparison, divide the minimum by the average. A higher minimum-to-average ratio means the darkest point is closer to the overall level, but the ratio is not useful unless the average also meets the crop plan.
When the center is high and corners are low, lowering the fixture may make the hotspot stronger and the footprint smaller. Raising it often spreads light more evenly but reduces intensity. Dimming changes intensity without necessarily fixing distribution. Moving bars, adding a second fixture, changing fixture orientation, reducing the planted footprint, or using appropriate reflective boundaries may change the map. Alter one variable, document it, and measure the full grid again.
Never copy a manufacturer map and assume it survives a layout change. Neighboring fixtures can add overlap; shelf frames and tall leaves can cast shadows; reservoir lids and reflective walls can redirect light. Map the operating system after installation.
6. Use plant observations as evidence, not as a light meter
University of Minnesota Extension notes that insufficient light can produce pale plants, long thin stems, wide spacing between nodes, and leaf loss, while excessive light can bleach or scorch leaves. Those signs are useful prompts, but water stress, nutrient imbalance, root problems, temperature, pests, and disease can look similar.
Pair observations with the seven-day reservoir log. A lighting change can alter solution temperature and plant water use, which can move volume and EC trends. Record the date of the lighting change on the reservoir chart so a new uptake pattern is not mistaken for a nutrient problem.
7. Log power, heat, controls, and service
Use actual input watts at the intended dimmer setting when available. Estimate daily electricity use as input watts multiplied by hours, divided by 1,000. Multiply daily kilowatt-hours by the local electricity rate for daily cost, then by the planned operating days. Keep assumptions visible; a rate, photoperiod, or dimmer change alters the answer.
Fixture efficacy matters, but delivered light and room heat matter too. Missouri Extension describes PPE as micromoles per joule and reports that current LEDs can exceed 2.5 µmol/J. The same guide points out that drivers can add heat to stacked systems and that some fixtures allow a separate driver location. Compare complete operating layouts, including mounting hardware, dimming, timer or controller compatibility, driver location, cleaning access, replacement path, and the cost of measuring the result.
- Actual input watts at full output and at the planned dimmer setting.
- PPF and PPE from current, traceable documentation.
- PPFD map at a height and footprint that fit the real canopy.
- Spectrum graph and intended crop/stage information.
- Minimum clearances, mounting parts, maximum ambient conditions, and moisture rating.
- Control method, fail state after a power interruption, and timer accuracy.
- Driver, cord, connector, and daisy-chain limits.
- Warranty, output-depreciation terms, replaceable parts, and support path.
Hydro Grow Hub keeps branded listings, prices, inventory, availability, and checkout disabled until supplier authorization and current specifications are documented. A useful future listing must reproduce the test conditions behind every map instead of reducing the decision to “covers four feet.”
The 30-minute light-map worksheet
- Write the target. Record crop, cultivar, stage, canopy dimensions, PPFD or DLI target, photoperiod, and source.
- Lock the setup. Record fixture, orientation, mounting height, dimmer, walls, neighboring lights, and natural-light condition.
- Map nine points. Measure corners, edge midpoints, and center at canopy height.
- Calculate. Find average, minimum, maximum, minimum-to-average ratio, and electric-light DLI.
- Observe the system. Record leaf response, air and solution temperature, reservoir volume, EC, and pH trend.
- Change one variable. Adjust height, dimming, spacing, orientation, or footprint within the fixture and crop instructions.
- Map again. Keep the before-and-after grids. Stop when the whole canopy fits the crop plan and the installation remains serviceable.
Use the homepage workspace planner to define the lighting job, then apply the listing standard to every fixture under consideration. The finished map becomes the acceptance test for installation and the baseline for later cleaning, aging, or layout changes.